
A common question I get from entrepreneurs is, “How do I know when my startup is about to implode?” It’s an important question and one that needs to be asked often. The answer is not a simple one as it depends on several factors.
You may have read about the 40% Rule. The rule states your growth rate plus your operating margin should equal 40%. Let’s look at this rule a bit closer using a five-year analysis, with year 1 not necessarily indicating first year in business. COR + Operating Expense includes cost of revenue and operating expense.
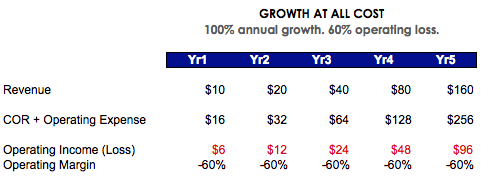
Growth At All Cost: 100% Growth and -60% Operating Margin
The Growth At All Cost scenario is a common scenario in venture-backed companies. The idea is your high revenue growth would offset the losses. However, this scenario does require a substantial amount of capital to sustain.
This scenario is acceptable on a long term basis for ad-based models, which require the company to build up a user base to sell ads against or monthly subscription models, which require substantial sales and marketing dollars to acquire a customer who will pay small amounts over monthly payments, eventually allowing you to recoup sales and marketing expenses. In general, we commonly see this scenario in growth companies — across various industries — looking to land grab where they can. The initial goal is growth, not profitability.
If your company is at this stage and can justify this performance you are safe, given that you can raise enough capital to stay afloat.
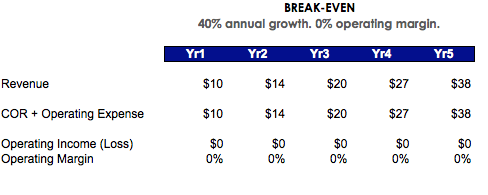
Break-Even: 40% Growth and 0% Operating Margin
The Break-even scenario is typically seen when a company is moving out of growth at all cost stage and is normalizing. On average, a company reaches break-even point near year three. However, it is highly dependent on your industry and growth strategy. For example, if you’re building a marketplace (low risk), you may reach profitability sooner than a company with an ad-based (high risk) model. A marketplace allows you to set up a platform and receive compensation once transactions occur, hence decreasing risk.
One caveat: a low risk revenue model (i.e. marketplace) can still incur significant year-over-year losses if it focuses on a growth at all cost strategy. Uber is an example of a company that should breakeven, yet continues to expand in various regions.
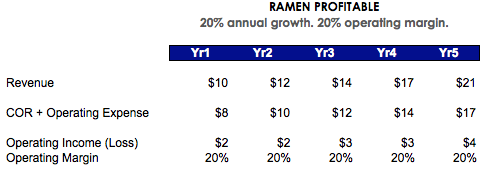
Ramen Profitable: 20% Growth and 20% Operating Margin
The Ramen Profitable scenario is typically seen when a company is moving out of break-even stage and gaining profitability. This is typically experienced beyond year three. However, as previously noted, it could take longer depending on industry and growth strategy. On the flip side, it could be achieved on day one if you are building something that is inexpensive to run and produces significant revenue.
Ideally you would continue on this path until you’ve reached the point of market saturation, defined as the point in which you can no longer gain market share. Unfortunately, some companies fall into two dreaded scenarios: Plateau or Decline.
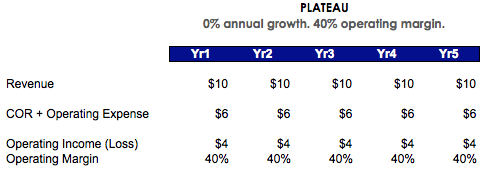
Plateau: 0% Growth and 40% Operating Margin
The Plateau scenario is typically seen when a company has stalled. Immediate action is needed to determine whether the customer profile has changed or whether the cause is economic forces outside of your control. For instance, has the customer pain point changed no longer requiring the product or service? We saw this when the demand for taxis was offset by the demand for black cars. Or perhaps the economy has changed and consumers are no longer spending in this segment. We saw this in the past few recessions. Consumers began to prioritize their spend and there was very little companies could do to change this behavior. In either case, if you are able to cut costs allowing for a 40% operating margin you have a chance at survival. The real question is: How long can you sustain this?
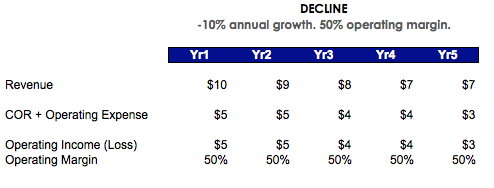
Decline: -10% Growth and 50% Operating Margin
The Decline scenario follows the Plateau scenario and is further indication that the company is in trouble. At this point, the company may want to determine whether a sale or divestiture is in order. If revenue is declining, the ability to sustain a 50% operating margin will become increasingly difficult.
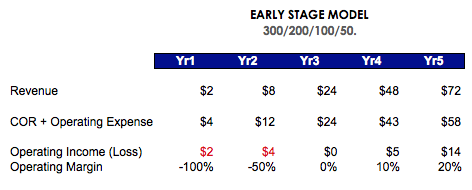
Early Stage Model: 300% to 50% Growth and -100% to 20% Operating Margin
On average, a company can expect to have high losses in the early years, break-even around year three and settle into 20% operating margins in year five. Naturally, this varies by industry but is a fair range.
The graph below illustrates how each of the six scenarios fits into the company lifecycle.
Modeling Early Stage Growth
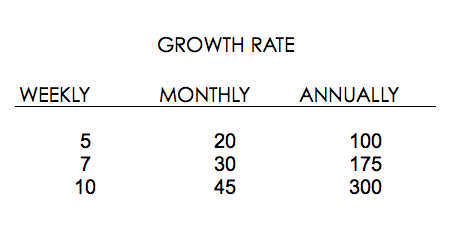
The 40% Rule provides high level scenarios for mature companies but if we want to see granular data for early-stage companies, we need to look at our weekly growth rate. A good benchmark for weekly growth rate is between 5% to 10%. If we extrapolate this growth rate out, we see that it aligns with the Early Stage Model. I rounded the numbers, but the weekly rates of 5% to 10% will get you close to 100% to 300% annual growth.
How to Track Your Numbers
I am a strong believer that you should track your metrics daily. Whether it’s revenue or users, the ability to spot issues is easier if you’re observing your metrics on a daily basis.
If you see your daily metrics slipping, you are in a position to make adjustments. If you track your metrics monthly you may miss a critical inflection point.
For more tips on startup finance, join our community here.